
Lee County had an average of 4,153 jobs in the first quarter of 2026, and they paid an average of $910 a week, according to the latest county file from the U.S. Bureau of Labor Statistics’ Quarterly Census of Employment and Wages. By The Lee Daily Register’s calculation, that is 54.7% of the $1,665 weekly average for Virginia as a whole, up from 52.6% in early 2019.
The tables here are our own work. We downloaded the January-to-March files for Lee, Wise and Scott counties and the state for 2019, 2025 and 2026, averaged the three monthly job counts, and worked out each share and ratio. Dividing Lee’s $49.1 million in first-quarter wages by its jobs and 13 weeks reproduces the $910, so it is an average per job, not per full-time worker.
Jobs are flat since 2019, but pay is up 46%
| Q1 2026 | Average jobs | Jobs vs. Q1 2019 | Weekly wage | Wage vs. Q1 2019 | Wage as % of Virginia |
|---|---|---|---|---|---|
| Lee | 4,153 | +0.3% | $910 | +45.8% | 54.7% |
| Wise | 10,730 | -8.5% | $945 | +44.7% | 56.8% |
| Scott | 4,813 | -3.8% | $922 | +51.9% | 55.4% |
| Virginia | 4,106,210 | +5.8% | $1,665 | +40.4% | 100% |
Lee’s job count is virtually unchanged from early 2019, while Wise has lost 8.5% of its jobs, Scott 3.8% and Virginia has gained 5.8%. Compared with a year earlier, Lee’s average fell 1.5%, from 4,216 to 4,153. The number of establishments, meaning worksites, slipped from 526 to 519, and it was 561 in early 2019, a drop of 7.5%.
Pay has moved faster than prices. The national consumer price index, CPI-U, averaged 29.5% higher in the first quarter of 2026 than in the same quarter of 2019, by our averaging of the three months. Set against that, Lee’s 45.8% gain in weekly pay is roughly 12.6% after inflation. That index is a national measure, not a local one.
Schools, stores and health services each supply about one job in six
| Lee County, Q1 2026 | Average jobs | Share of all jobs | Weekly wage | Wage as % of Virginia’s, same industry |
|---|---|---|---|---|
| Retail trade | 689 | 16.6% | $560 | 71% |
| Local government: schools | 685 | 16.5% | $801 | 71% |
| Private education and health services | 684 | 16.5% | $828 | 65% |
| Federal government | 417 | 10.0% | $1,904 | 73% |
| Leisure and hospitality | 303 | 7.3% | $314 | 54% |
| Construction | 204 | 4.9% | $956 | 59% |
| State government | 147 | 3.5% | $1,180 | 85% |
| Manufacturing | 136 | 3.3% | $1,089 | 65% |
| Mining | 63 | 1.5% | $1,364 | 77% |
Retail, local schools and private education and health services are within five jobs of one another. BLS reports local-government education as a single establishment. Mining’s 63 jobs are up from 24 in early 2019, though still 1.5% of the total. The state’s Virginia Works county profile lists the largest employers for the third quarter of 2025 in ranked order but gives no job counts. It puts the Lee County School Board first, then the U.S. Department of Justice, Walmart, Lee Nursing & Rehabilitation and the County of Lee.
Government pays half again as much as private employers
Federal, state and local government together account for 1,479 Lee County jobs, or 35.6% of the total. Wise is at 35.2%, Scott at 28.7% and Virginia at 18.1%. By our calculation from total wages and jobs, the average government job in Lee paid $1,157 a week, against $773 in the private sector, a gap of about 50%.
Statewide the pattern is reversed. Virginia’s private jobs averaged $1,683 and government jobs $1,582. So Lee’s government pay is 73% of the state’s, while its private pay is 46%. Since early 2019, Lee’s government jobs have fallen from about 1,521 to 1,479, and private jobs have risen from about 2,621 to 2,674.
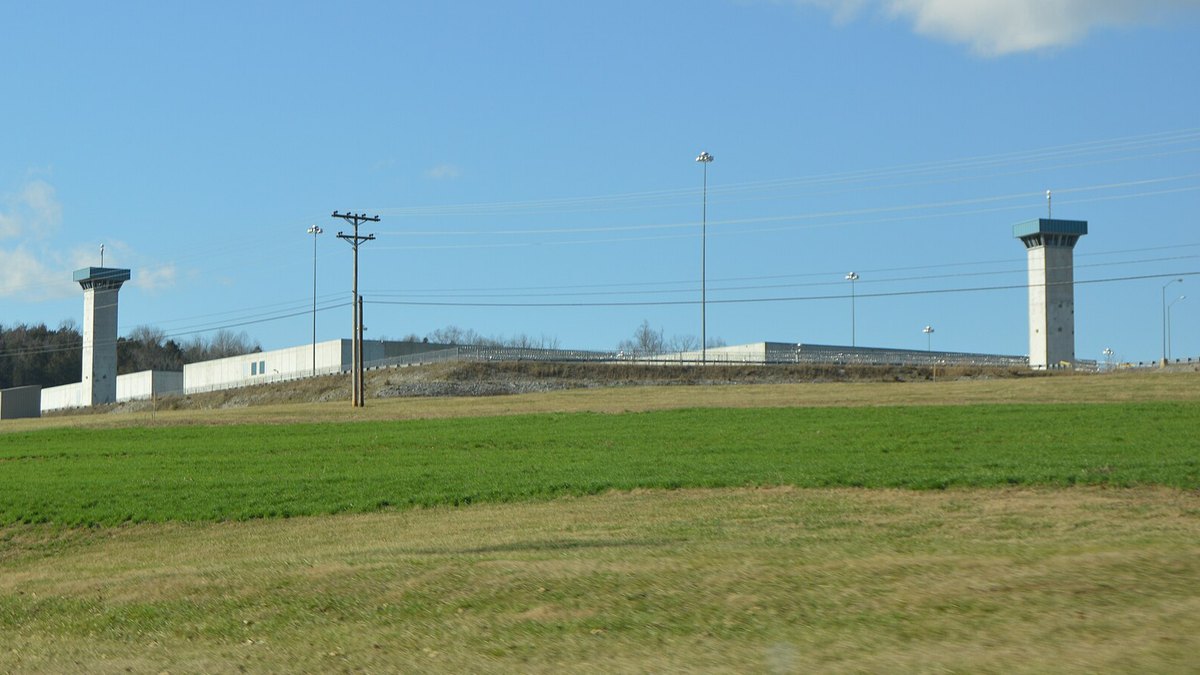
The federal figure covers all agencies, and BLS does not say which make up the 417 jobs. The Federal Bureau of Prisons, a division of the Justice Department, operates the U.S. Penitentiary, Lee in the county. Virginia Works lists the department without naming a facility, and neither source gives the prison’s staff size.
What the state data keeps confidential
BLS marks some industry rows “not disclosed” and publishes no jobs or wages for them, as its file layout describes. In Lee’s first-quarter file, 30 of 52 detailed private industries are marked that way. So are four of the 20 broader private groups, which hold 250 of the county’s 467 private establishments. Health care and social assistance accounts for 226 of those, with a count of worksites but no job or wage figure.
Only two health-care pieces are public: doctors’ offices and other outpatient care, with 273 jobs at $1,146 a week, and nursing and residential care, with 197 jobs at $699. Subtracting them from the 684 private education-and-health jobs leaves roughly 214 in hospitals, social assistance and private education, which BLS does not break out. Mining’s two sub-groups are also withheld, as is Wise County’s mining total, so a mining comparison with Wise is not possible.
These figures come from employer reports and leave out self-employed people, according to BLS. As of Oct. 31, the first quarter of 2026 is the newest quarter published, and BLS’s release calendar schedules the second quarter for Dec. 2.
